
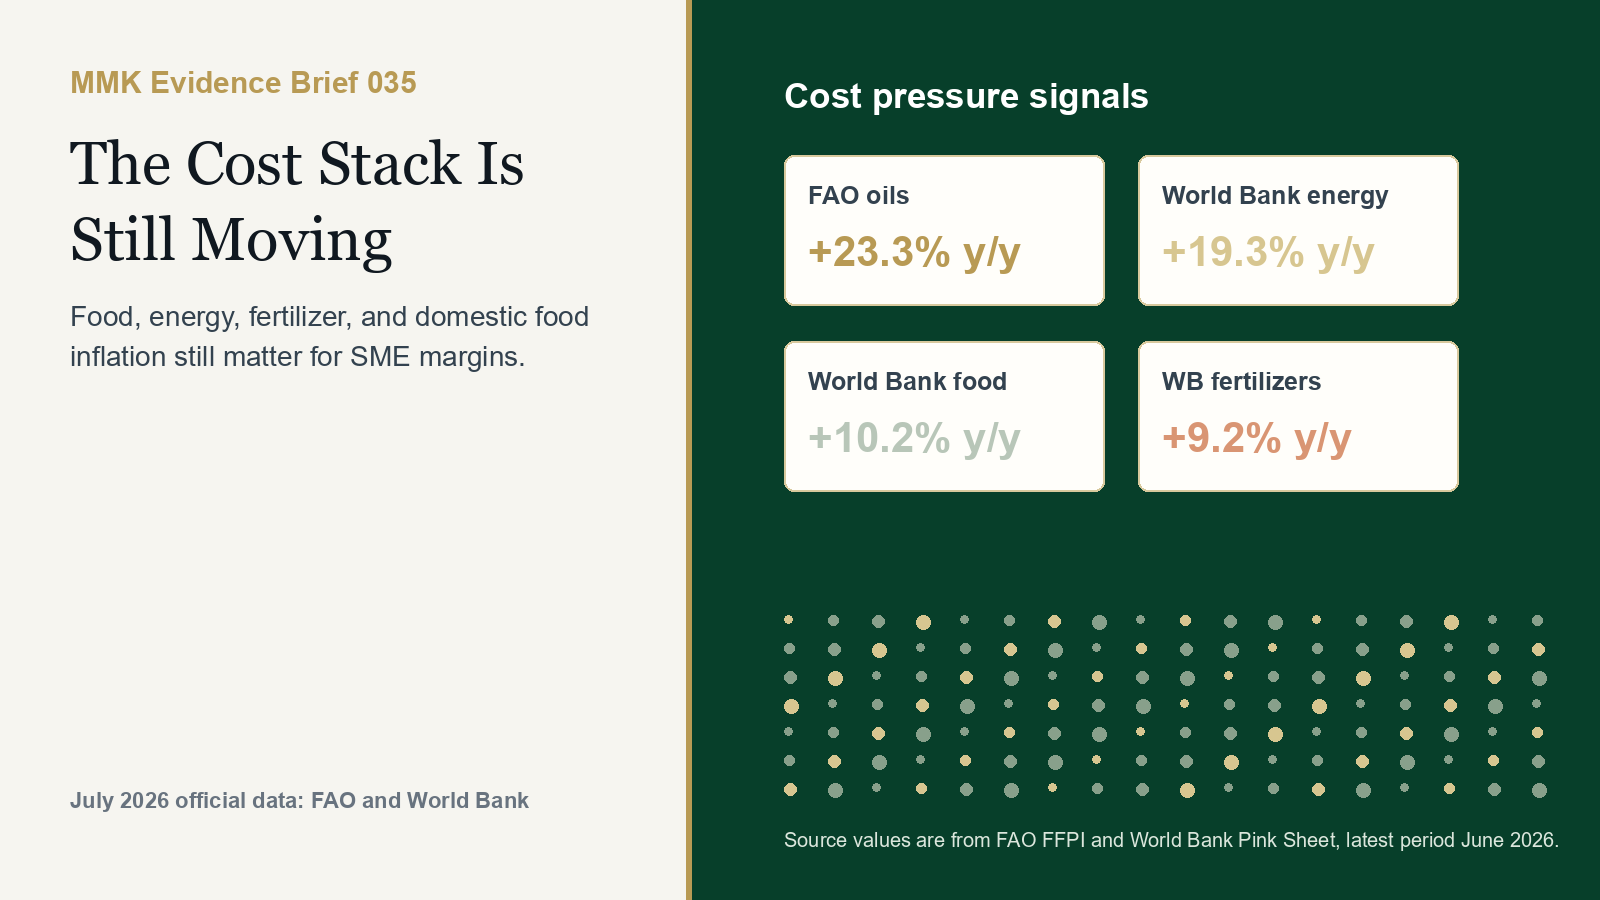
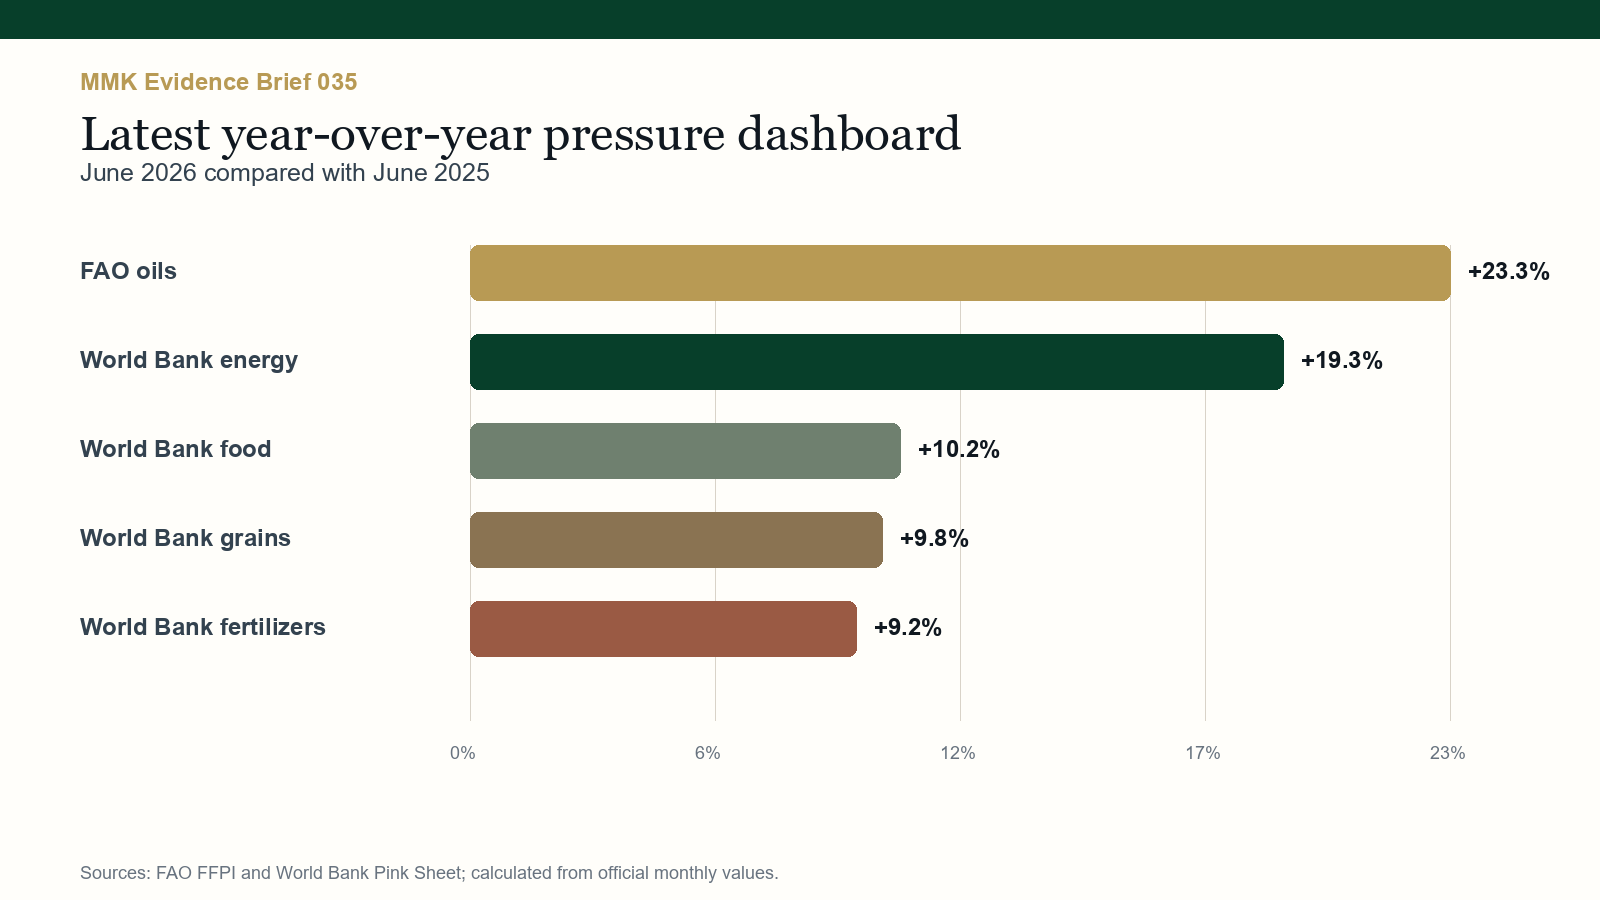
The cost stack is still moving. FAO's June 2026 Food Price Index stood at 130.3, down 0.3% from May but still 1.7% above June 2025. The detail matters more than the average: FAO's oils index was 23.3% above last June, while World Bank June indices show food up 10.2%, energy up 19.3%, grains up 9.8%, and fertilizers up 9.2% year over year.
In brief
- What changed. July source updates show a cooler month-on-month signal, but June 2026 input costs remain materially above June 2025.
- Why it matters. SMEs feel the shock through supplier quotes, freight, packaging, inventory finance, customer affordability, and delayed cash conversion.
- What leaders should do. Manage the cost stack by margin triggers, not by headlines: reprice where the data says pressure is persistent, and protect cash where customers are stretched.
The signal
The headline is not panic. The headline is discipline. FAO's broad food index eased slightly in June, and World Bank energy and fertilizer indices also fell from May. But year-over-year comparisons still show a higher operating-cost floor than SMEs had a year ago.
That combination is dangerous for small firms because it can feel like relief while margins remain exposed. A retailer, distributor, food-service operator, processor, or agribusiness supplier can sell the same volume and still lose contribution margin if oils, grains, fuel-linked logistics, or fertilizer-linked supply costs move faster than pricing routines.
What the evidence suggests
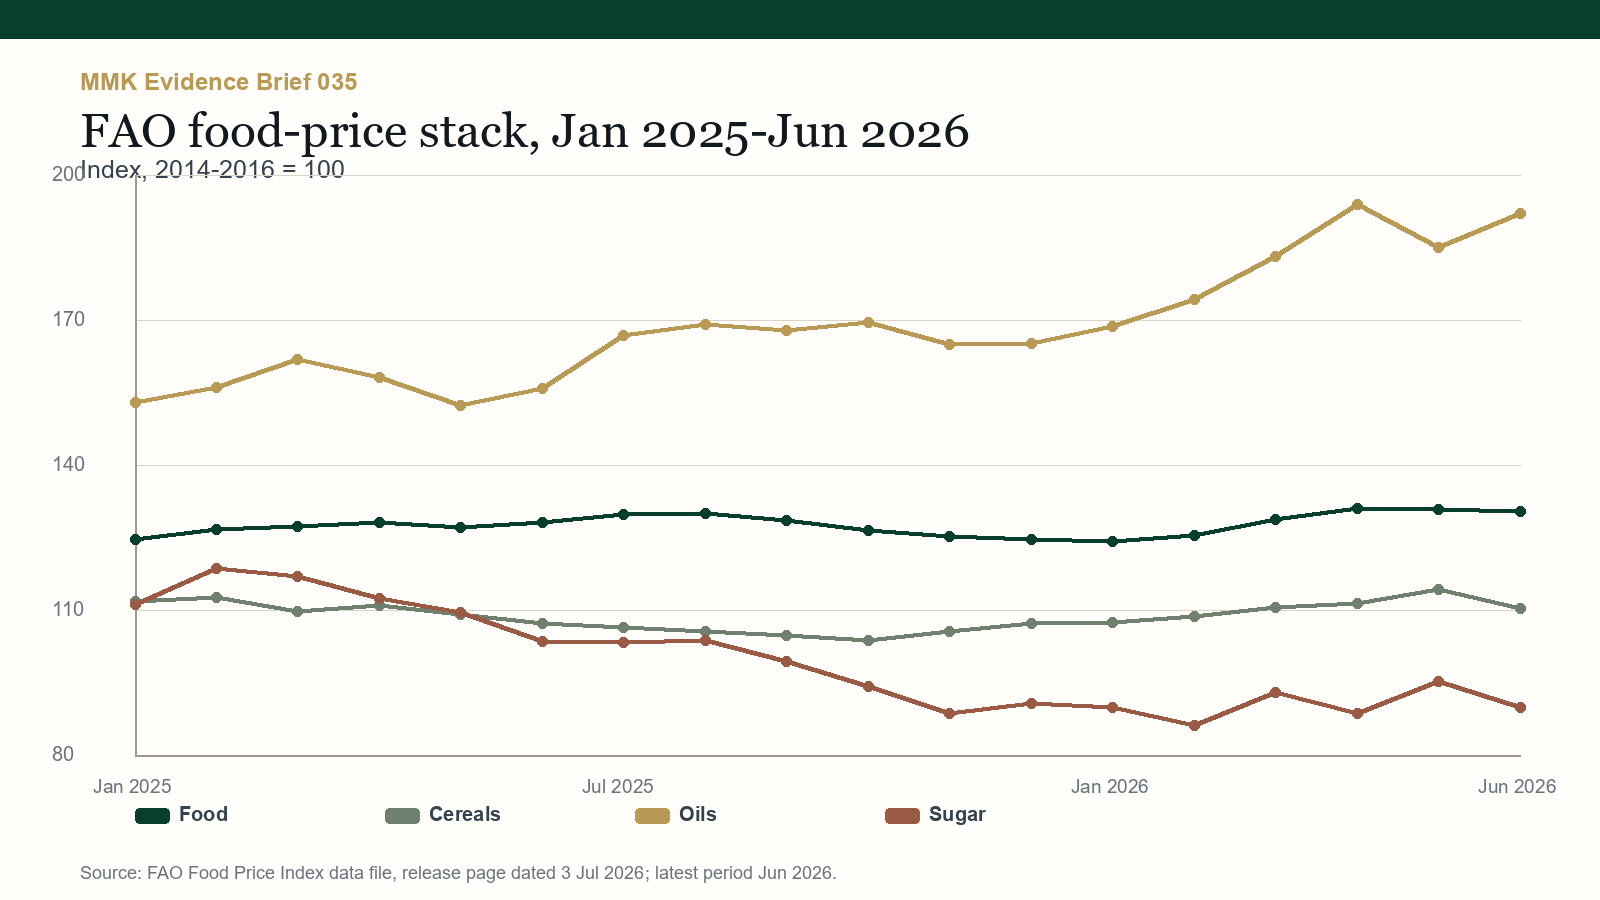
FAO's July 2026 data release shows why SMEs should separate the headline food index from the input categories that sit inside gross margin. Food was only 1.7% above a year earlier, but oils were up 23.3% and cereals were up 2.7%.
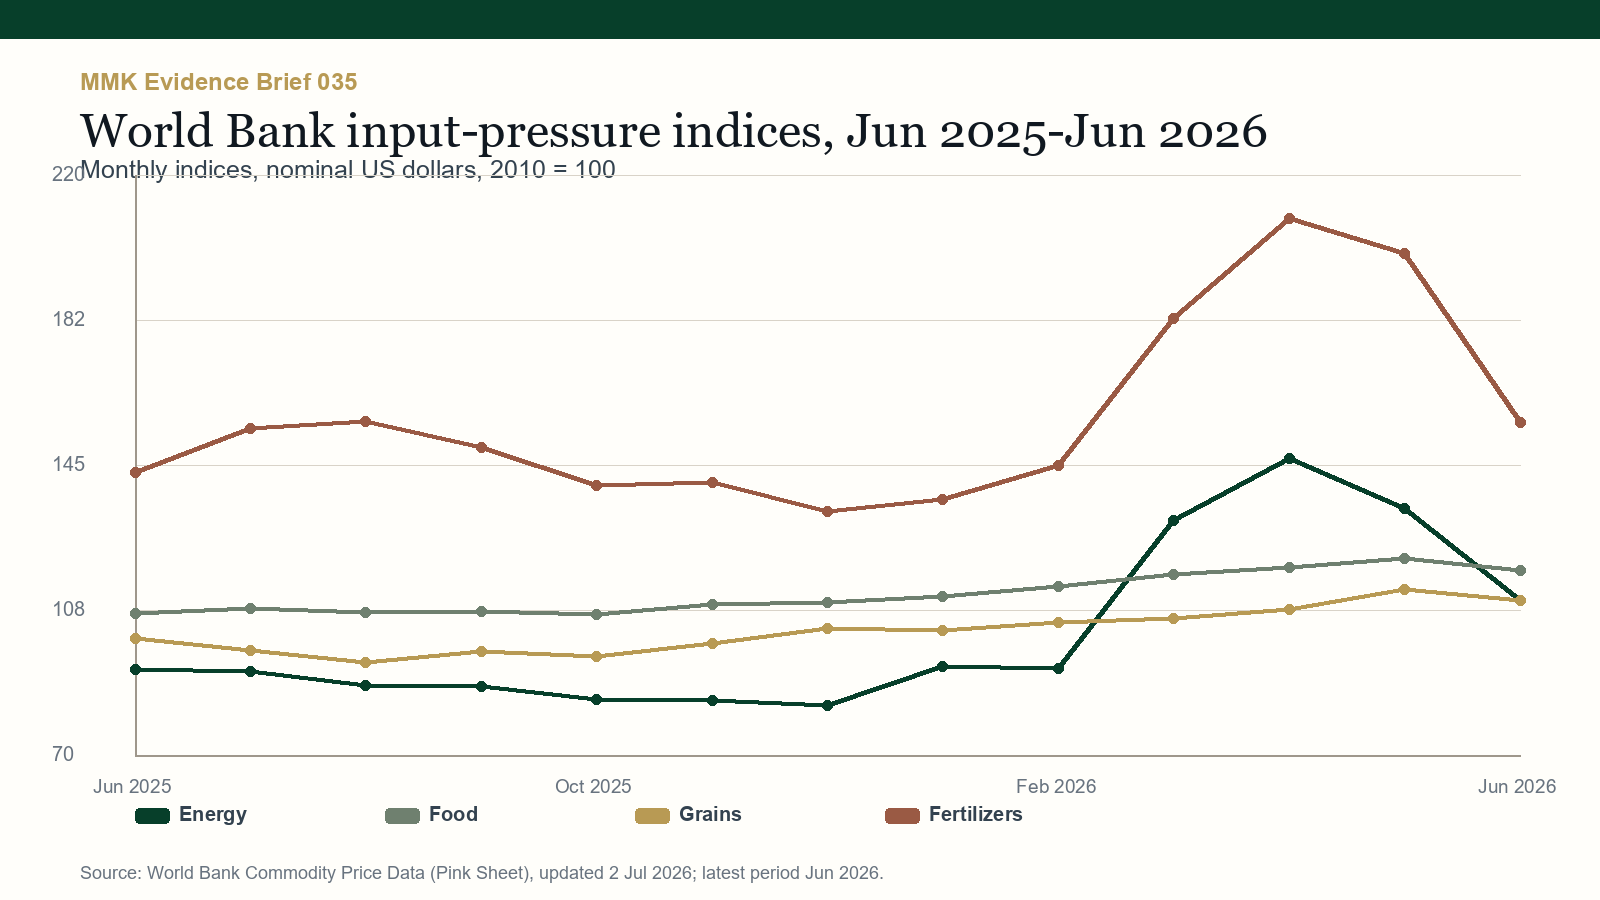
World Bank Commodity Price Data updated on 2 July 2026 adds the energy and fertilizer layer. Energy was 19.3% higher than June 2025 and fertilizers were 9.2% higher, even after sharp month-on-month easing in June. That is a supplier-pricing and cash-flow signal, not only a macro statistic.
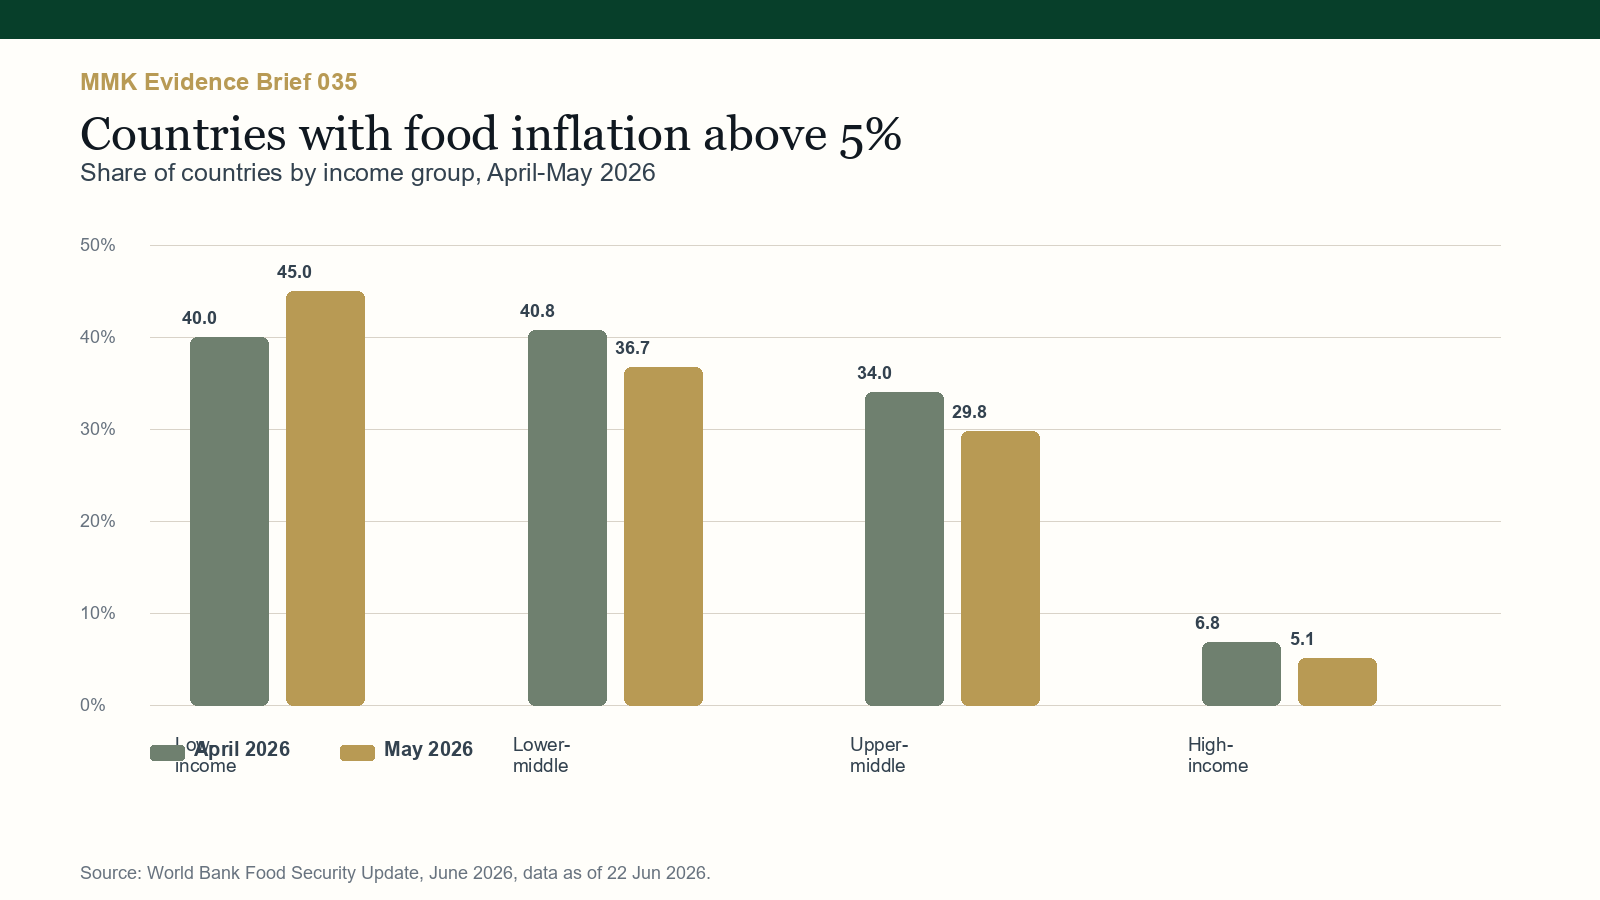
World Bank's June 2026 Food Security Update keeps the demand-side risk visible. It reported that the share of low-income countries with food inflation above 5% rose from 40.0% to 45.0% between April and May 2026, while fertilizer prices in the first five months of 2026 were 35% higher than in the same period a year earlier.
What this means for your business
SMEs should not wait for a single inflation headline to tell them when to act. Margin pressure arrives through line items: a supplier shortens quote validity, a distributor changes delivery fees, customers trade down, or a fast-moving SKU starts carrying slow-moving cash.
The practical response is to build triggers. If oils, fuel-linked delivery, grains, or imported packaging move beyond a threshold, the business should already know which prices, pack sizes, discounts, supplier terms, and reorder quantities change. This is not only a finance task. It is a sales, procurement, operations, and customer-evidence task.
Evidence box
FAO Food Price Index: 130.3 in June 2026, 1.7% above June 2025.
Source: FAO Food Price Index data, release page dated 3 July 2026The broad food basket has eased slightly but remains above last year's level.FAO Oils Price Index: 23.3% above June 2025.
Source: FAO Food Price Index data, June 2026Food-service, retail, and processing margins need category-level review, not only headline food tracking.World Bank Energy Index: 19.3% above June 2025.
Source: World Bank Commodity Price Data, updated 2 July 2026Delivery, cold-chain, generator, and supplier-cost assumptions need active review.World Bank Fertilizers Index: 9.2% above June 2025.
Source: World Bank Commodity Price Data, updated 2 July 2026Upstream pressure can pass through to food-linked supply chains with a lag.Low-income countries with food inflation above 5% rose from 40.0% to 45.0% between April and May 2026.
Source: World Bank Food Security Update, June 2026Customer affordability remains a constraint even where global monthly prices soften.Practical actions
- Build a weekly cost-stack dashboard. Track the three to five inputs that actually decide gross margin for each product family.
- Set repricing triggers before pressure hits cash flow. Decide in advance which price, bundle, discount, or pack-size changes activate when input costs move past a threshold.
- Separate volume from contribution. Flag SKUs that keep sales high but absorb fuel, supplier, or credit costs faster than prices adjust.
- Renegotiate supplier mechanics. Ask for shorter quote windows, split deliveries, alternative inputs, and payment terms that match customer cash conversion.
- Test customer tolerance with evidence. Use small price tests, customer interviews, and segment-level sales data before making broad increases.
What to watch next
Watch the next FAO food-price release, the August World Bank Pink Sheet, domestic fuel-price decisions, central-bank FX policy, import-duty changes, and local food-inflation prints. For SMEs, the risk is not only where global prices move. It is how quickly those movements reach supplier terms and household purchasing power.
MMK advisory angle. MMK Consult helps SMEs and institutions turn macro signals into decision-ready operating work: pricing reviews, margin diagnostics, market intelligence, supplier-risk scans, customer evidence, and feasibility notes leaders can defend.
Sources
- FAO Food Price Index release and data file, 3 July 2026
- World Bank Commodity Price Data (Pink Sheet), updated 2 July 2026
- World Bank Pink Sheet July 2026 PDF
- World Bank Food Security Update, June 2026
- World Bank Food and Nutrition Security Update edition 123, June 2026 PDF
- FAO Crop Prospects and Food Situation, 2026 release schedule and July report page