
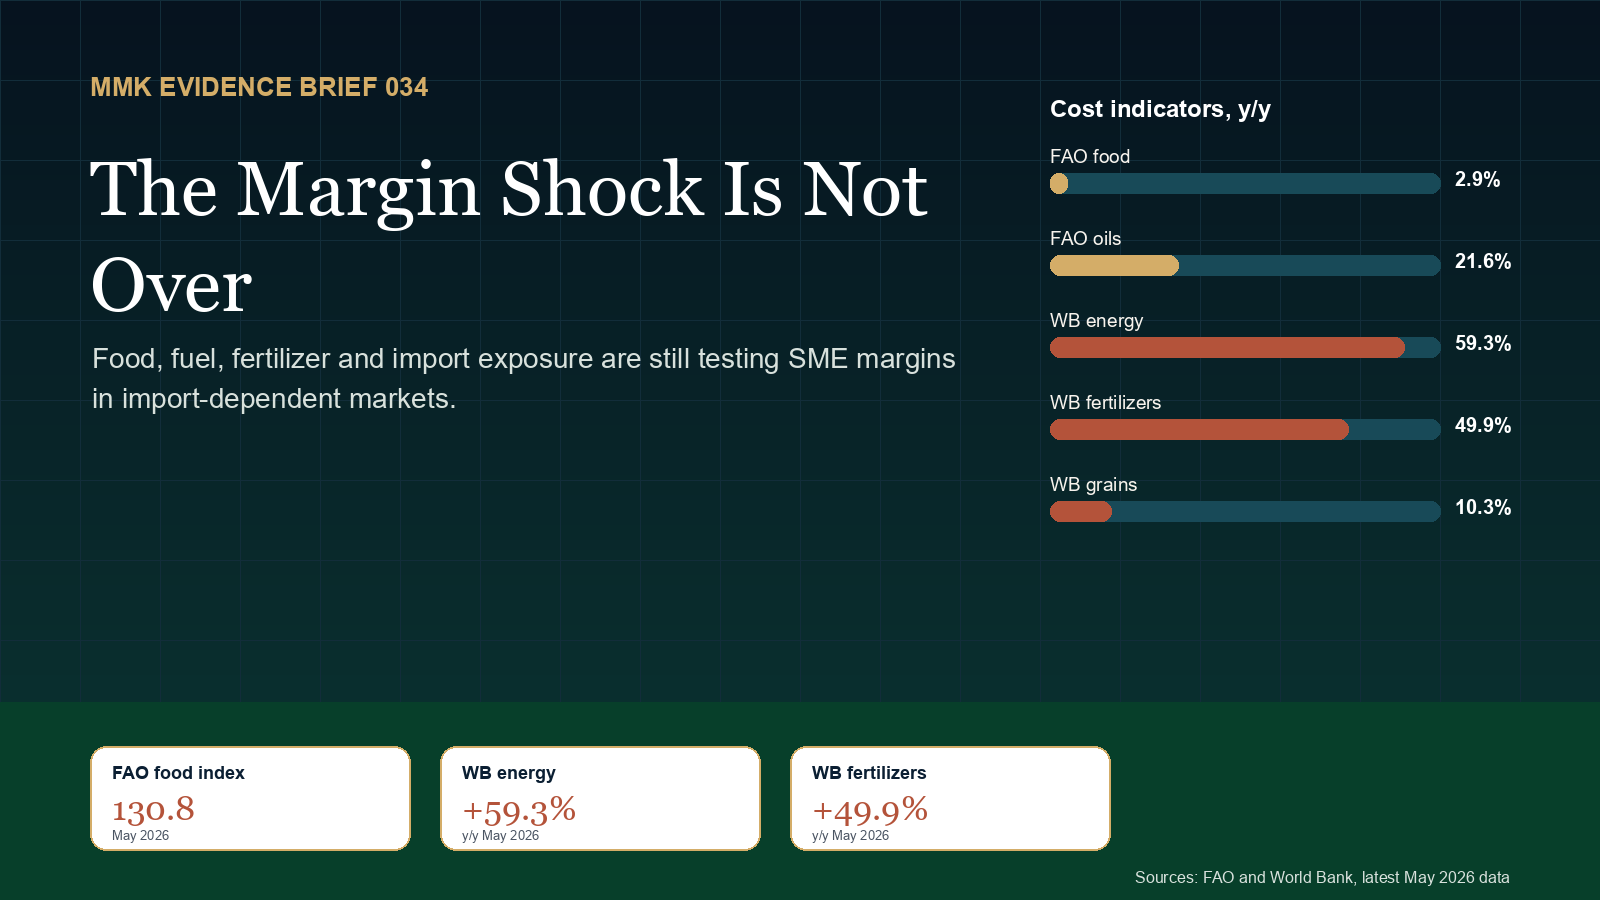
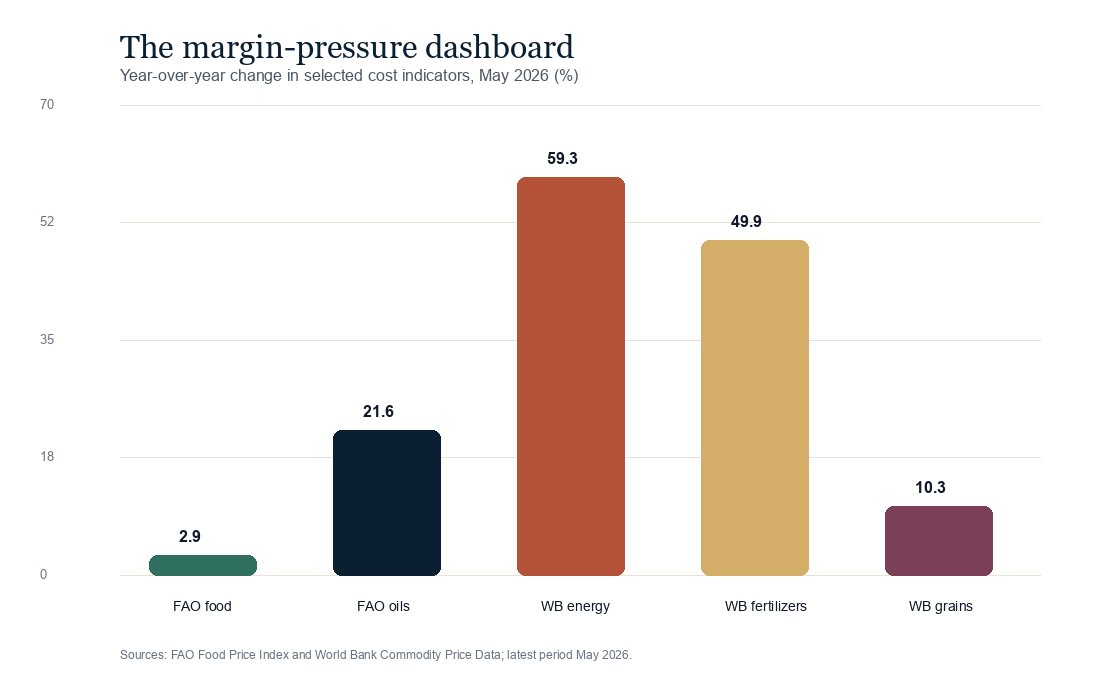
The margin shock is not over. FAO data put the Food Price Index at 130.8 in May 2026, 2.9% above May 2025. World Bank monthly commodity indices show a sharper pressure stack underneath: energy up 59.3%, fertilizers up 49.9%, and grains up 10.3% year over year in May 2026.
In Brief
- What changed. The latest official data show a split signal: the headline FAO food index was nearly flat month on month, but oils, fuel, fertilizers and grains still create a live cost stack for SMEs.
- Why it matters. Import-dependent businesses absorb this through suppliers, transport, packaging, inventory finance, customer affordability and working capital, not through one visible invoice.
- What leaders should do. Move from monthly sales tracking to weekly margin tracking, reprice smaller items faster, and protect cash from low-margin volume.
The Signal
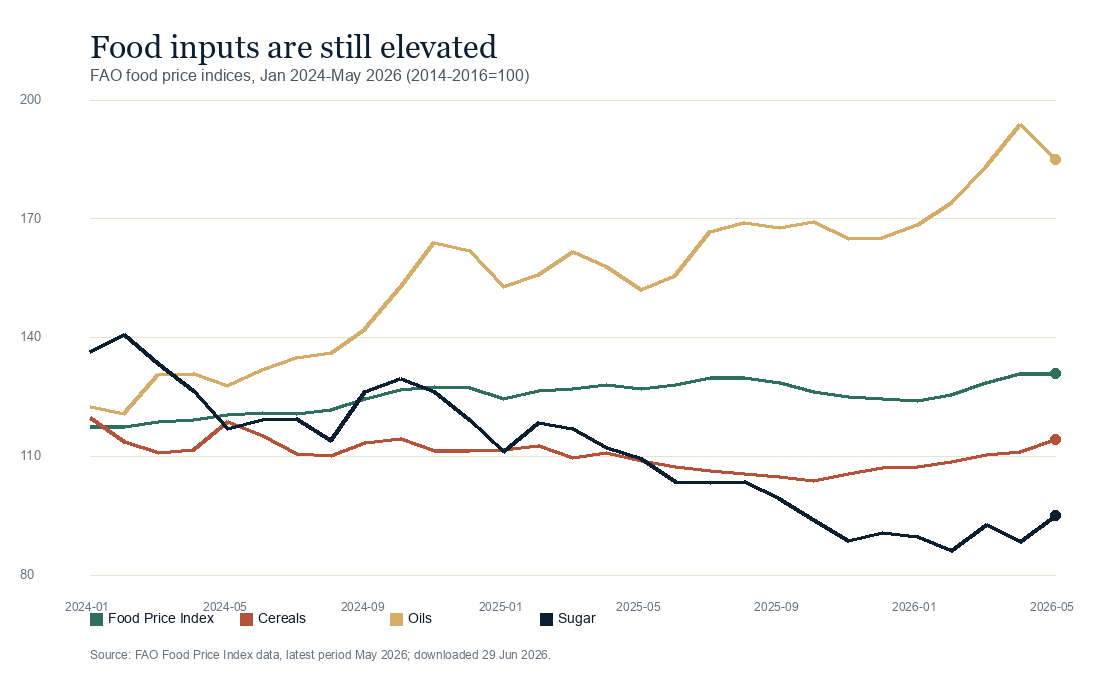
The important signal is concentration. FAO's broad food basket rose only 2.9% year over year in May 2026, but its oils subindex rose 21.6% and cereals rose 4.9%. Averages can hide the inputs that determine whether a retailer, processor, food-service operator or distributor has margin left after procurement and delivery.
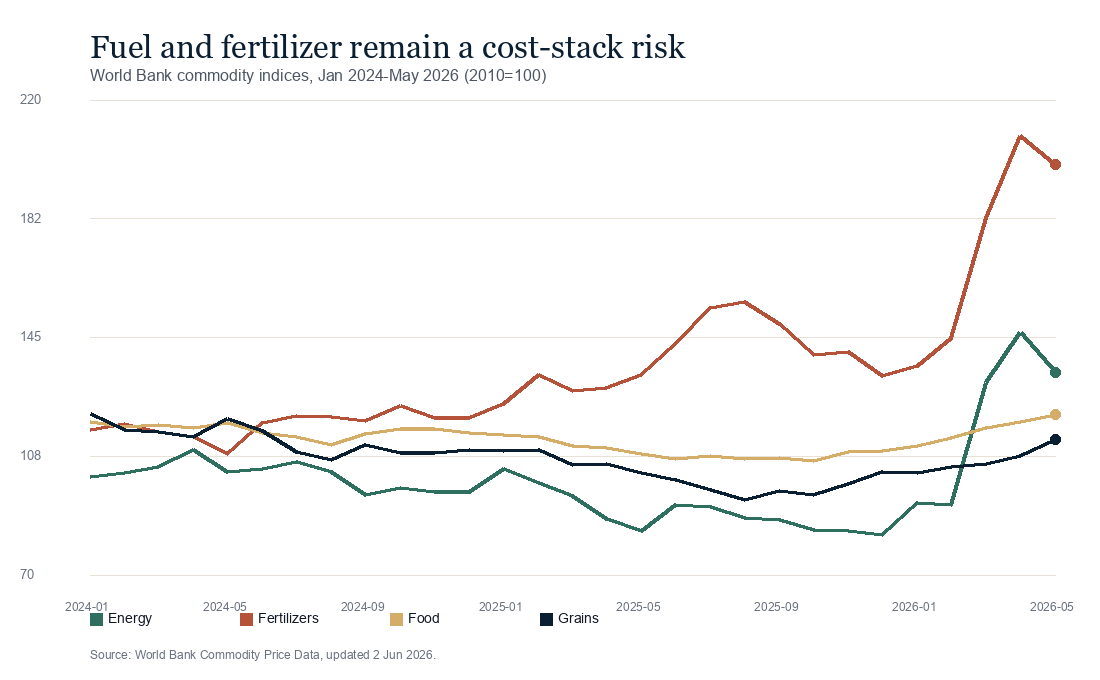
World Bank commodity indices sharpen the warning. Energy was 59.3% higher than a year earlier in May 2026 and fertilizers were 49.9% higher. Those are not only farm-sector numbers. They affect food supply chains, transport bills, import landed cost, supplier credit terms and the prices that households can absorb.
What The Evidence Suggests
FAO's 5 June 2026 release is useful because it separates the overall food basket from the categories that matter most to cost pass-through. For SME leaders, the practical reading is simple: do not manage pricing from the headline index alone. Track the input categories that sit inside your gross margin.
World Bank Commodity Price Data updated on 2 June 2026 shows the second layer of pressure. Energy and fertilizer movements remain large enough to change supplier quotes, delivery charges and inventory economics even when food inflation headlines sound less dramatic.
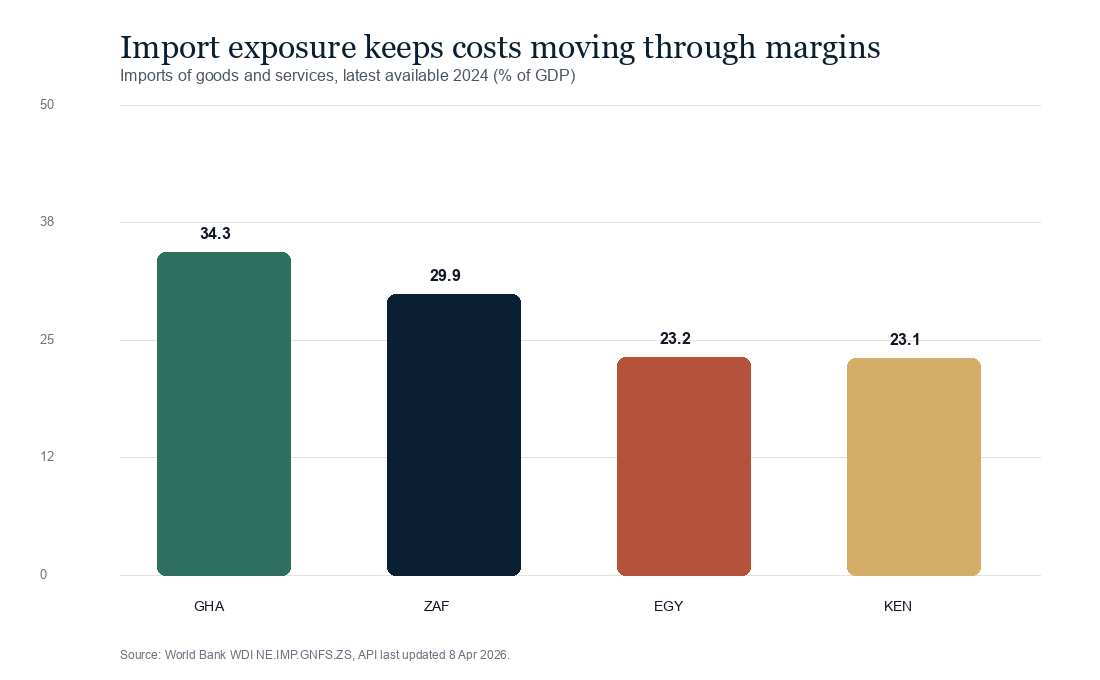
World Bank WDI import data adds the exposure lens. In selected African markets with complete 2024 data, imports of goods and services were equivalent to 34.3% of GDP in Ghana, 29.9% in South Africa, 23.2% in Egypt and 23.1% in Kenya. The WDI extract returned null values for Nigeria for 2019-2024, so Nigeria is not charted here.
What This Means For Your Business
If the business imports directly, buys through import-linked distributors, or sells to households whose budgets are already stretched by food and transport, the risk is not just inflation. The risk is delayed response. Sales can remain stable while contribution margin quietly declines.
The right question is not whether the cost-of-living shock is back in the headlines. It is whether your pricing, procurement and working-capital routines can see pressure early enough. Many SMEs wait for monthly accounts; the cost stack moves faster than that.
Evidence Box
FAO Food Price Index: 130.8 in May 2026, 2.9% above May 2025.
Source: FAO Food Price Index data, release page dated 5 June 2026The broad food basket remains elevated even though the month-on-month move was small.World Bank Energy Index: 59.3% year over year in May 2026.
Source: World Bank Commodity Price Data, updated 2 June 2026Transport and delivery assumptions need more frequent review.World Bank Fertilizers Index: 49.9% year over year in May 2026.
Source: World Bank Commodity Price Data, updated 2 June 2026Food-linked supply chains face upstream pressure that can pass through with a lag.Selected import exposure: Ghana 34.3% of GDP in 2024.
Source: World Bank WDI indicator NE.IMP.GNFS.ZS, API last updated 8 April 2026Import dependence can turn global cost movements into local margin pressure.Practical Actions
- Run a weekly gross-margin review. Track margin by product line and customer segment, not only total sales.
- Reprice in smaller increments. Frequent small adjustments are easier to defend than delayed large jumps.
- Separate profitable volume from vanity volume. Cut discounts or bundles that move stock but destroy contribution margin.
- Renegotiate supplier assumptions. Ask for shorter quote validity, alternative pack sizes, split deliveries or substitute inputs before pressure reaches cash flow.
- Stress-test working capital. Model what happens if energy, fertilizer-linked inputs or imported goods rise another 10% while receivables slow by two weeks.
What To Watch Next
Watch the next FAO monthly release, World Bank Pink Sheet updates, local fuel-price decisions, central-bank FX policy and customs or food-import measures. For SMEs, policy changes can alter pass-through speed as much as the commodity price itself.
MMK advisory angle. MMK Consult helps SMEs, founders and institutions convert macro pressure into specific operating decisions: pricing reviews, margin diagnostics, customer evidence, feasibility work, market intelligence and decision-ready strategy notes. The point is not to describe the shock. It is to decide what changes before the shock reaches the income statement in full.